
Deep learning method for synthesis of tabular data
In this post I present a study conducted here at Boogie Software by the Boogie Artificial Intelligence Team. The purpose is to investigate the feasibility of deep learning techniques for synthesis of tabular data. The study is carried out through an example case where bank transaction data is used. The subject is relevant for example to the open banking initiative discussed earlier in our blog post, and is a continuation of a post which discussed the use of banking data for predictive analytics.
I start by introducing the concepts of data synthesis and a particular deep learning method called Generative Adversarial Networks. After the introduction, I describe our work on the synthesis of bank transaction data, and present that the method succeeds in synthesizing categorical, numerical and date variables. I conclude that the method can be used for creating software test data and also for training machine learning models.
Data synthesis
Have you ever had a novel idea for utilizing data, but dropped the idea simply because the data is inaccessible? Or, wouldn’t it be great to do software development with test data resembling the private data used in production? Synthetic data can help here.
Is your data too private to share?
Data synthesis is the act of generating artificial data for the purposes of software development, system testing or data analysis. Synthetic data can mimic the data produced by measurements or collected from customer actions. Unlike real data, synthetic data can be anonymous and shared without any privacy concerns, and it can be generated in unconfined quantities. Minimally, the synthetic data is expected to represent the real data at a formal level, while at its best it can replace the real data for analysis or machine learning purposes. Methods for synthesis vary depending on the kind of data and on the requirements imposed on it. There is active research going on, see for example “Data synthesis based on Generative Adversarial Networks” and “The synthetic Data Vault”.
Generative Adversarial Networks in transaction synthesis
A class of deep learning methods called Generative Adversarial Networks (GAN) has gained a wide interest during the last years especially through the advances in image synthesis. Synthetic images generated by GANs are conceptually somewhat like dreams: all the inputs from reality blend together in their different forms and combine into outputs which do not have a correspondence in reality but still feel familiar. If the topic is new to you, check out the wonder of synthetic celebrity images and the wide range of applications of GANs.
Here we investigate a practical approach with potential in opening wide landscapes for industrial use of GANs. We are interested in the synthesis of data which is in tabular form. Tables of data are everywhere, many sealed in the binary vaults of industries, but glimmering there as valuable as gold. If the gold can’t be shared, share a synthesized version of it!
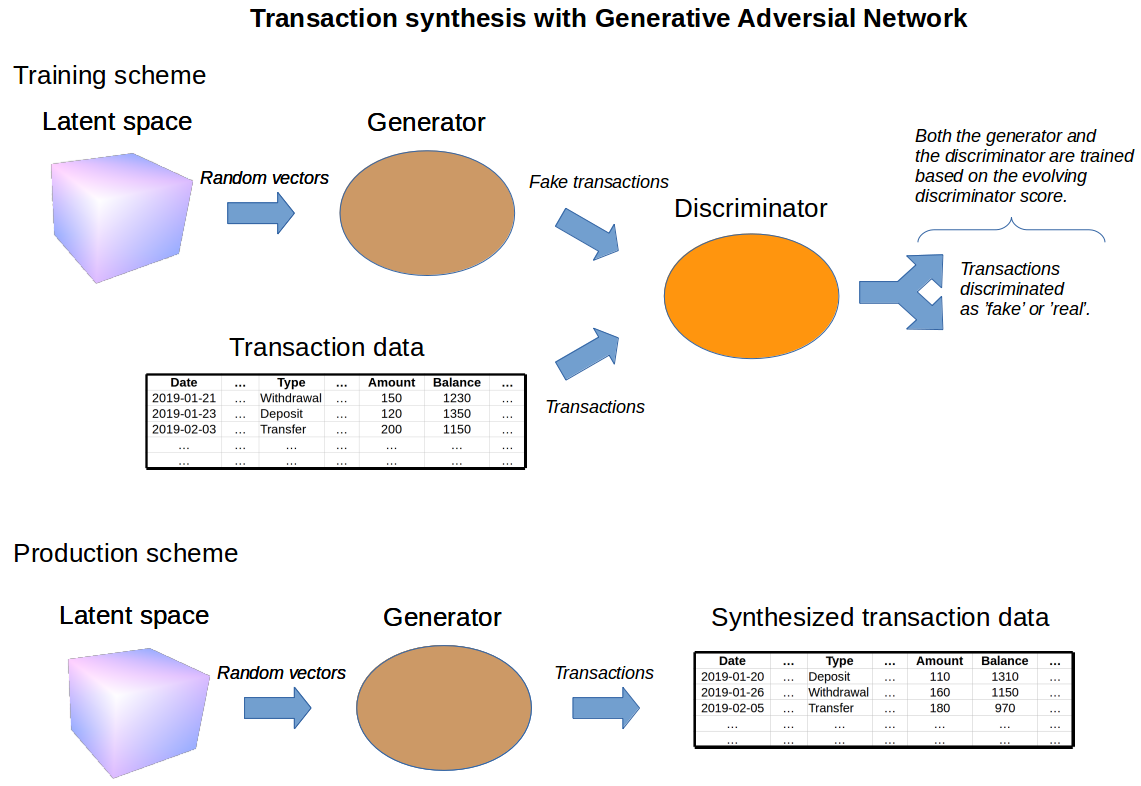
The high-level concepts for synthesis of transaction data with GAN are depicted in the figure above. The main components of GAN are called a generator and a discriminator. The generator is a neural network, which maps random numbers into fake transaction samples. The discriminator is another network, which takes in these fake samples together with samples from real data and classifies each sample as either real or fake. The discriminator aims to classify the samples correctly, while the generator aims to fool the discriminator. During the network training, the feedback from the improving discriminator forces the generator to generate transactions that are similar to the real ones.
After the training is finished, the trained generator can be used to create authentic-looking data. Just input any number into the generator and it will output a transaction!
Our exercise with banking data
The data set used in our synthesis exercise contains ca. 1 million transactions from 4500 different customers. It is one of the most versatile public banking data sets available online and contains information of all main aspects of bank transactions: date and amount of transaction, account balance and transaction categories (ie. characteristics of the transaction, such as transaction type, bank and payment information).
We have experimented with different GAN architectures and training approaches, and we found that Wasserstein GAN (WGAN) is preferred for synthesis since it is stable to train and yields the best results. We train the network using cloud services hosting virtual machines employing graphics processing units (GPU). We test multilayer perceptron architectures (MLP) for which the training time can be up to ~10 hours.
Evaluation of synthesized transactions
After the generator is trained, synthesized data is easily produced in unconfined numbers, and we are interested in the statistical resemblance between the data and the synthesized version of it. The synthesis works well for categorical, numerical and date variables, as shown in the figures below.
Categorical variables
| Relative number of transactions for different transaction categories in real data (blue) and synthesized data (red). Each marker denotes a specific combination of transaction categories (A marker indicates for example the number of cash withdrawals, the number of incoming pension transactions from a particular bank, and so on). |
The relative numbers of different transaction categories are well preserved in the synthesis, as the figure above clearly demonstrates. The numbers of the most common transactions are accurately produced, and the synthesized data matches the real data over a wide range of frequencies. The numbers of some of the most infrequent categories are underproduced. Generally, the longer the network is trained, the more of the categories are correctly produced.
Numerical variables
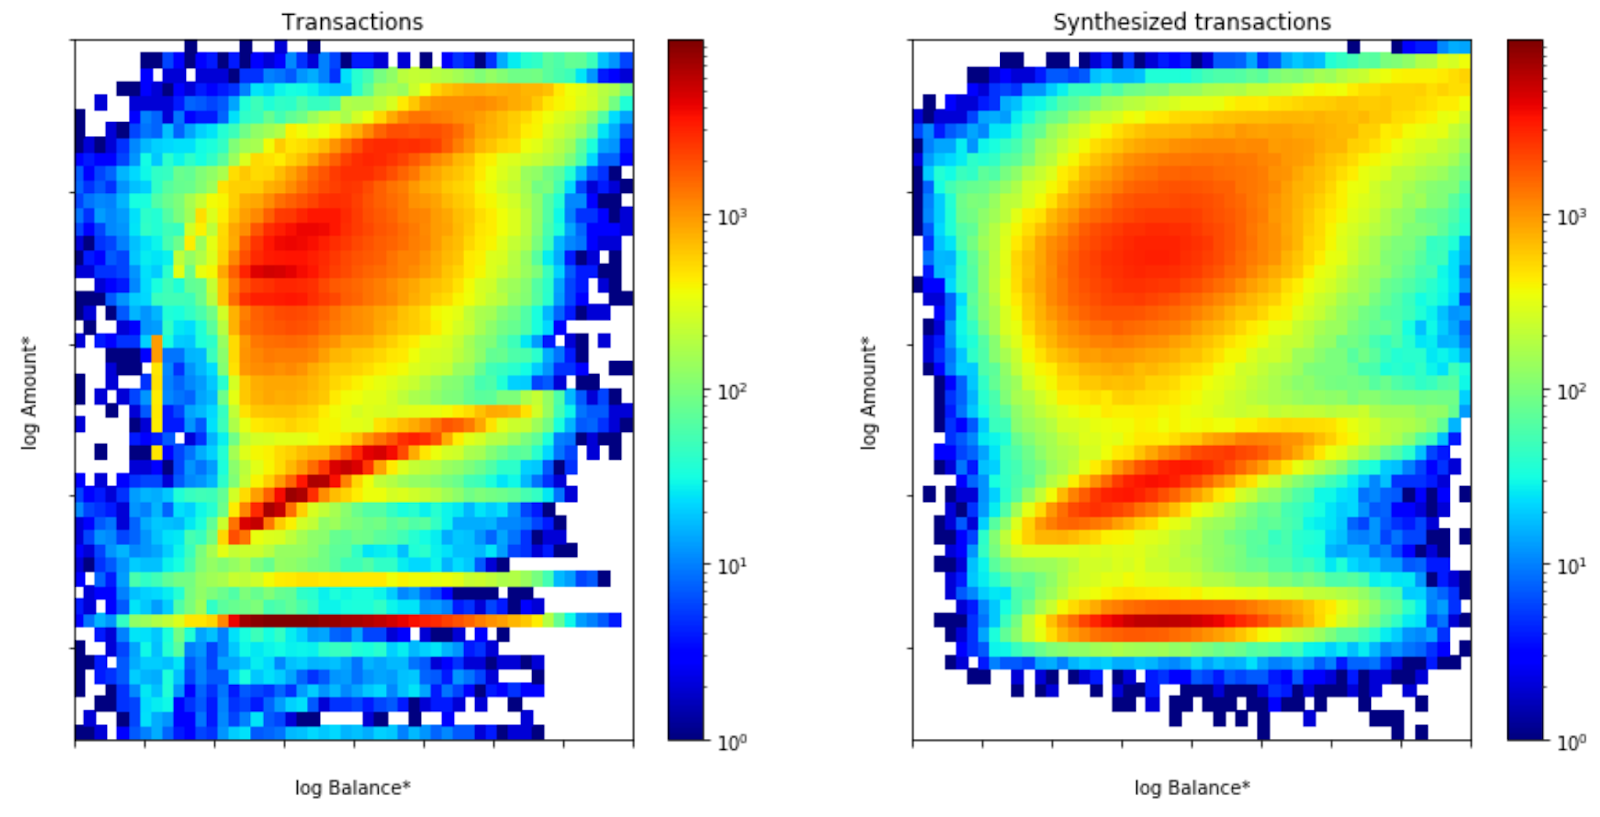 |
| The distribution of transactions as a function of transaction amounts and account balances for real data (left) and for synthesized data (right). The colors indicate the number of transactions. Note that the axes are logarithmic, and that the colors pronounce the smallest details in data. |
The figure above shows the number of transactions as a function of transaction amount and account balance. The data clearly shows three dominant regions (’red’ regions in the figure), which correspond to transactions with different amounts. These three regions are correctly produced in the synthesis, and, as indicated by the shapes of the regions, the synthesis also captures the covariance between the variables!
Date variables
| The distributions of days of the month (left panel) and months (right panel) of the transactions. The distributions are shown for both the real data (blue) and synthetic data (red). |
The dates of transactions are also correctly synthesized as depicted in the figure above.
GAN succeeds in generating synthetic data with the following properties: the relative numbers between different categories, the distribution of dates of the transactions, and the distributions of transaction amounts and account balances are preserved. Much of the covariance between the variables is preserved. The synthesis does neglect or transform some fine details of the data in an unpredictable way. Depending on the requirements of its use, this can be seen either as a limitation or as a preferred feature of the synthesis.
Usability of synthetic data for machine learning?
In our machine learning example, we first classify all customers into separate classes. The classification is based on the aggregated values of account balances and transaction amounts, as well as on the temporal densities of different transaction categories. See the figure below for a visualization of the customer classes.
 |
| Spectral clustering of different customers visualized in PCA (Principal Component Analysis) space. Each marker represents one customer and colors indicate the customer class. |
We then label each transaction by the class of the customer carrying the transaction, and the label is also included in the synthesis. We train Gradient Boosting Classifiers to predict the labels of real transactions, and compare the classification metrics between models trained on synthetic and real data. The metrics are shown in the figure below.
 |
|
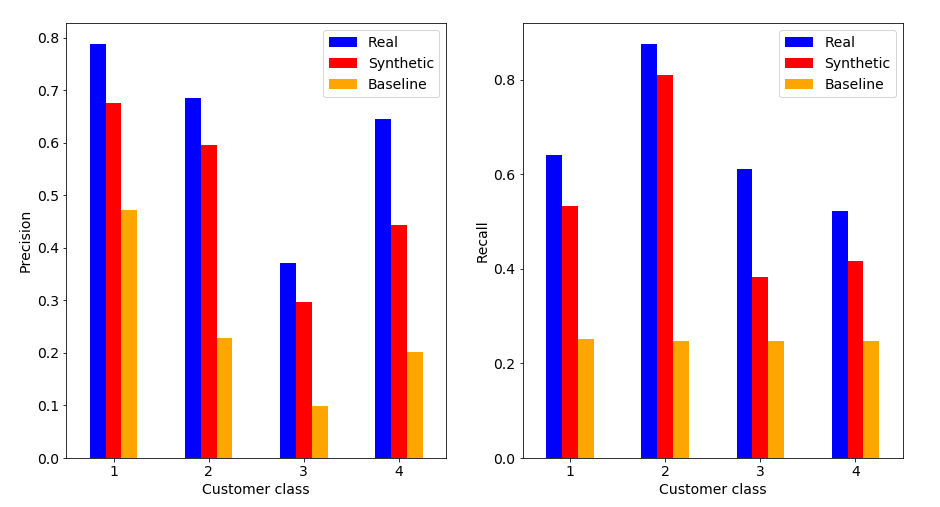
| The classification metrics for four major customer classes. Precision (the fraction of correct predictions) (right panel) and recall (the fraction of labels which are correctly predicted) (left panel). The classifier is trained either with real transactions (blue) or with synthetic transactions (red). The baseline prediction denotes random guesses for the labels (orange). All cases are evaluated against the real transaction set. |
The classifier trained on the synthetic data approaches the quality of the classifier trained on the real data, and is way better than a random guess.
Concluding remarks
Our work above demonstrates that a class of deep learning technique called Generative Adversarial Networks can be used to synthesize data in tabular form. This was shown through the example case of bank transaction synthesis, but the method should be applicable to different types of tabular data as well. Synthesized data can be a perfect replacement of data for technical testing of software systems.
The example scenario of transaction classification shows that the data synthesized by GAN can be used at least as an initial step in the development of machine learning models, but it would be an overstatement to conclude that it can replace it altogether. The applicability will surely depend on the problem in question.
Personally I feel that GANs are very interesting option for data synthesis. Only future work will tell how much more these intelligent machines are able to do!
If you’re interested around any of the topics discussed, check out the AI Team offering and contact us.
References
- Boogie Software Oy is a private Finnish company headquartered in Oulu, Finland. Our unique company profile builds upon top level software competence, entrepreneurial spirit and humane work ethics. The key to our success is close co-operation with the most demanding customers, understanding their business and providing accurate software solutions for complex problems.
- The open bank data used in the article can be found in the following link https://sorry.vse.cz/~berka/challenge/.
- The analysis has been done using numpy, pandas, lightgbm and scikit-learn Python libraries. The figures have been created using matplotlib and seaborn libraries.
- For building and training deep learning models keras library and tensorboard visualizations are used. Our code utilizes the wgan-improved repository for WGAN training.