
Synthesizing Demographic Data

Synthetic data is data that resembles real data but is generated artificially. There are various methods to create synthetic data. The simplest way to generate data might be picking random values from a range or a list. More sophisticated methods include agent based solutions, bayesian sampling and neural networks.
Synthetic data can be helpful in various test and development scenarios where real data is not available. Real data is often sensitive, and as such it cannot be used without access control and other precautions. In some situations real data may be too scarce for building a particular feature, even when there are no any privacy restrictions.
In this article I present results of an experiment where I used our Data Synthesizer Solution on a demographic dataset to evaluate synthetic data applicability for machine learning. The data used is the Census Income (KDD) Dataset from UCI Machine Learning Repository.
TLDR; Synthetic data can be used to develop machine learning models, with certain restrictions. See the Conclusions chapter for a summary.
More information about the Boogie Software Data Synthesizer solution available on our website at https://boogiesoftware.com/datasynth/.
Dataset preparation
The source dataset has about 200000 rows. There are separate data files for training and and testing. The full dataset column count is 42. For this experiment, I chose a subset of 14 columns. There are 5 continuous (numerical) variables, and 9 categorical ones in my training data. Selected columns:
Age: continuous
Workclass: 9 values
Education: 17 values
Marital status: 7 values
Major Occupation code: 15 values
Sex: 2 values
Race: 5 values
Capital gains: continuous
Capital losses: continuous
Country of birth: 43 values
Work weeks: continuous
Wage per hour: continuous
Household status summary: 8 values
Income category: 2 values (-50000 / 50000+ a year)
There is no time series features in the data, so I’ve used the sample synthesis component from our Data Synthesizer Solution.
Evaluation of the synthesis result
Our sample synthesizer uses Wasserstein Generative Adversarial Network (WGAN) architecture. It can be used to generate synthetic data that retains statistical characteristics found in the training data, while the individual samples in training data cannot be identified from the synthetic counterpart.
It is customary to have a neural network loss graphs available through TensorBoard. For the Boogie Software Data Synthesizer, we have built in-training visibility to the performance of the network with control plots that show how the synthesis works on selected details of the data. This is particularly helpful with GAN models, since there is no direct correspondence from an individual loss term to quality of the output.

To reach these control plots, model was trained 15 minutes on a laptop without GPU (time is dependent on the data volume, the required data similarity level and available compute power). Our solution can be run in AWS SageMaker or Google Cloud AI platforms to maximise performance on large datasets.
After training, I created a synthetic dataset of the similar volume with the training data (200000 samples). Then I ran a pairwise mutual information test, resulting in the following diagram.
Pairwise mutual information (real vs synthetic)
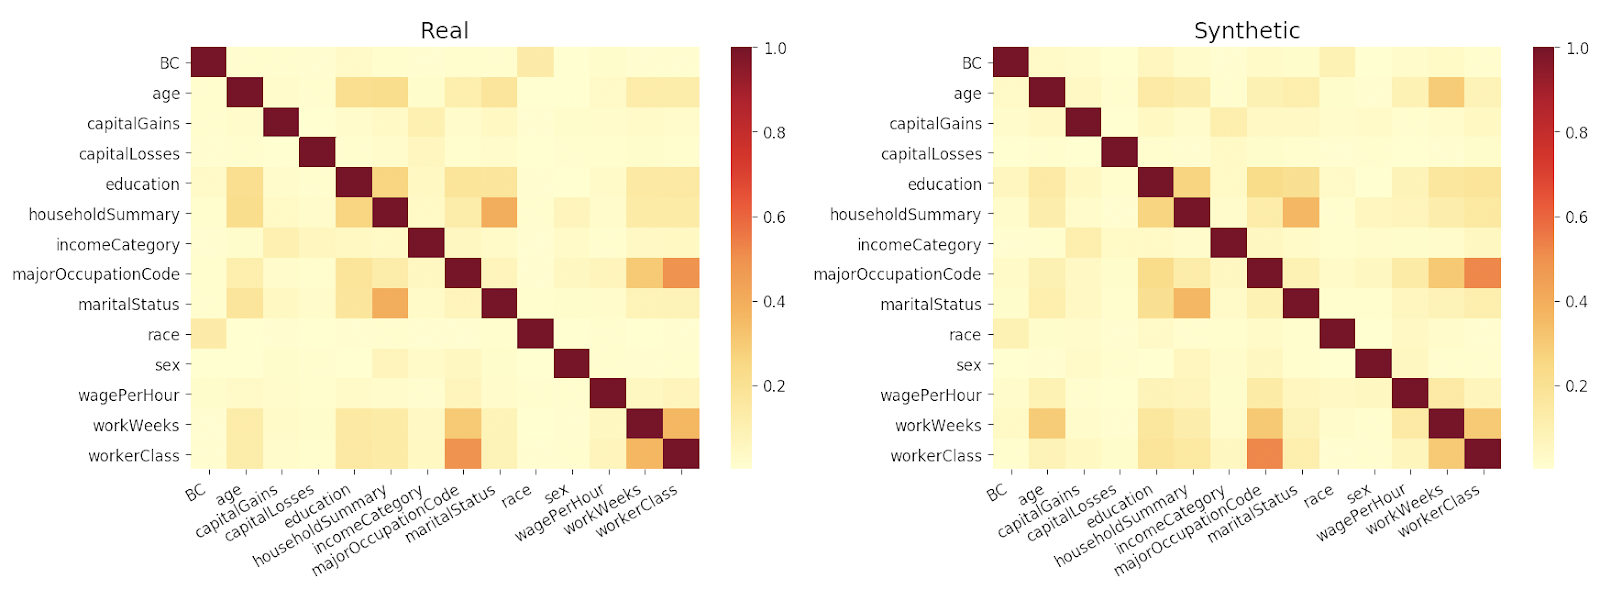
From this comparison we can see that in overview the cross-column correlations are retained in the generated synthetic data.
Synthetic data utility in machine learning
Synthetic datasets can prove to be useful in various scenarios as listed above. But is it possible to do data science with synthetic datasets?
This dataset is often used as an example for binary classification with imbalanced data, meaning that there are significantly different volumes of negative and positive cases. In this data, only a bit over 6% of the rows have income category of 50000+. This makes it challenging for a classification algorithm to reach high accuracy on both classes. Therefore it is not a good idea to look at the accuracy of the prediction as a single value – a classifier that puts ALL the samples in the low income category will still reach overall accuracy of 94% due to the imbalance. To get a better understanding on model performance, ROC curves and precision-recall curves can help.
For comparing the results, I trained a classifier for the real data and synthetic data separately. A small grid search was done to find the best hyperparameters which resulted in ROC AUC score of 0.98 and Precision-Recall score of 0.71 on the training data. Same hyperparameters were then used for training the classifier on both real and synthetic datasets. After training the LightGBM model, the classifier was evaluated against holdout data (real data that was never seen by either the synthesis or the classification algorithms).
The following graphs show how the model trained with real data performs as compared to model trained with synthetic data created with Boogie Software Data Synthesizer (wgan). To put the result in context, I trained three open source data synthesis implementations and then trained new classifiers on the synthetic datasets created with each of these. The compared synthesizers were Synthetic Data Vault (sdv) and Tabular GAN (tgan) from Mit Data to AI Lab, and DataSynthesizer from DataResponsibly (drds).
* Note that I have not used a lot of time to configure the comparison synthesizers, but used them with the default settings. It is likely that each synthesizers score could be different with a different set of parameters.
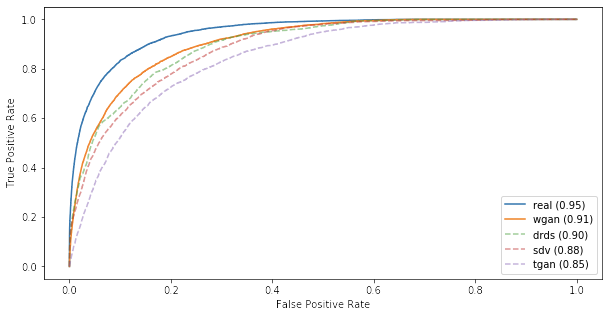
Not bad, the model trained with synthetic data performs reasonably well. When we look at the precision-recall curve though, the results is not as appealing.
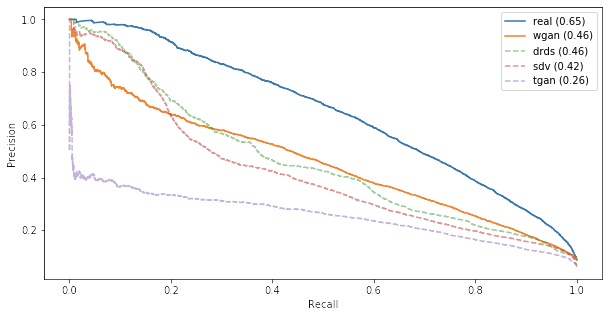
All the models trained on synthetic data yield significantly lower precision-recall score than the model trained with real dataset. However, in a quick search for optimal classifier parameters on the synthetic data, I achieved a gain of 0.04-0.05 on the precision-recall score.
A peek at the model insight
The column-specific comparison and pairwise mutual information analysis show that the synthetic dataset created with Boogie Software Data Synthesizer is statistically similar to the real data. The classifier trained on synthetic data performs relatively well on the holdout real dataset particularly in the ROC and Precision-Recall curves. The final test I did was to compare how the trained model applies weight to different features in the data using SHAP, a tool that can be used to visualise the inner workings of virtually any machine learning model.
In this plot, you can see the average impact of each feature on the model output visualized on the holdout data. Class 0 is low income, Class 1 is high income. The key takeaways from this comparison:
- Both models assign the most weight on the same features (age, workWeeks).
- The distribution of impact magnitude is similar.
- The model trained on synthetic data seems to be a slightly more biased on race and marital status as compared to the model trained on real data, but the difference is not huge.

Conclusions
1. There is no chance beating a model trained with real data…
2. …But when real data is not available, synthetic data can be used to develop and train machine learning models.
3. Iterating on the model to reach better performance on synthetic data will result in better performance also when the model is applied in a real-world scenario.
Further reading
At Boogie Software website and blog:
- Boogie Software AI Services
- Boogie Software Data Synthesizer Solution
- Deep Learning Method For Synthesis of Tabular Data
Elsewhere:
- On the Utility of Synthetic Data: An Empirical Evaluation on Machine Learning Tasks (Hittmeir, Ekelhart & Meyer 2019)